Why Your Lab's Normal Range Isn't Universal
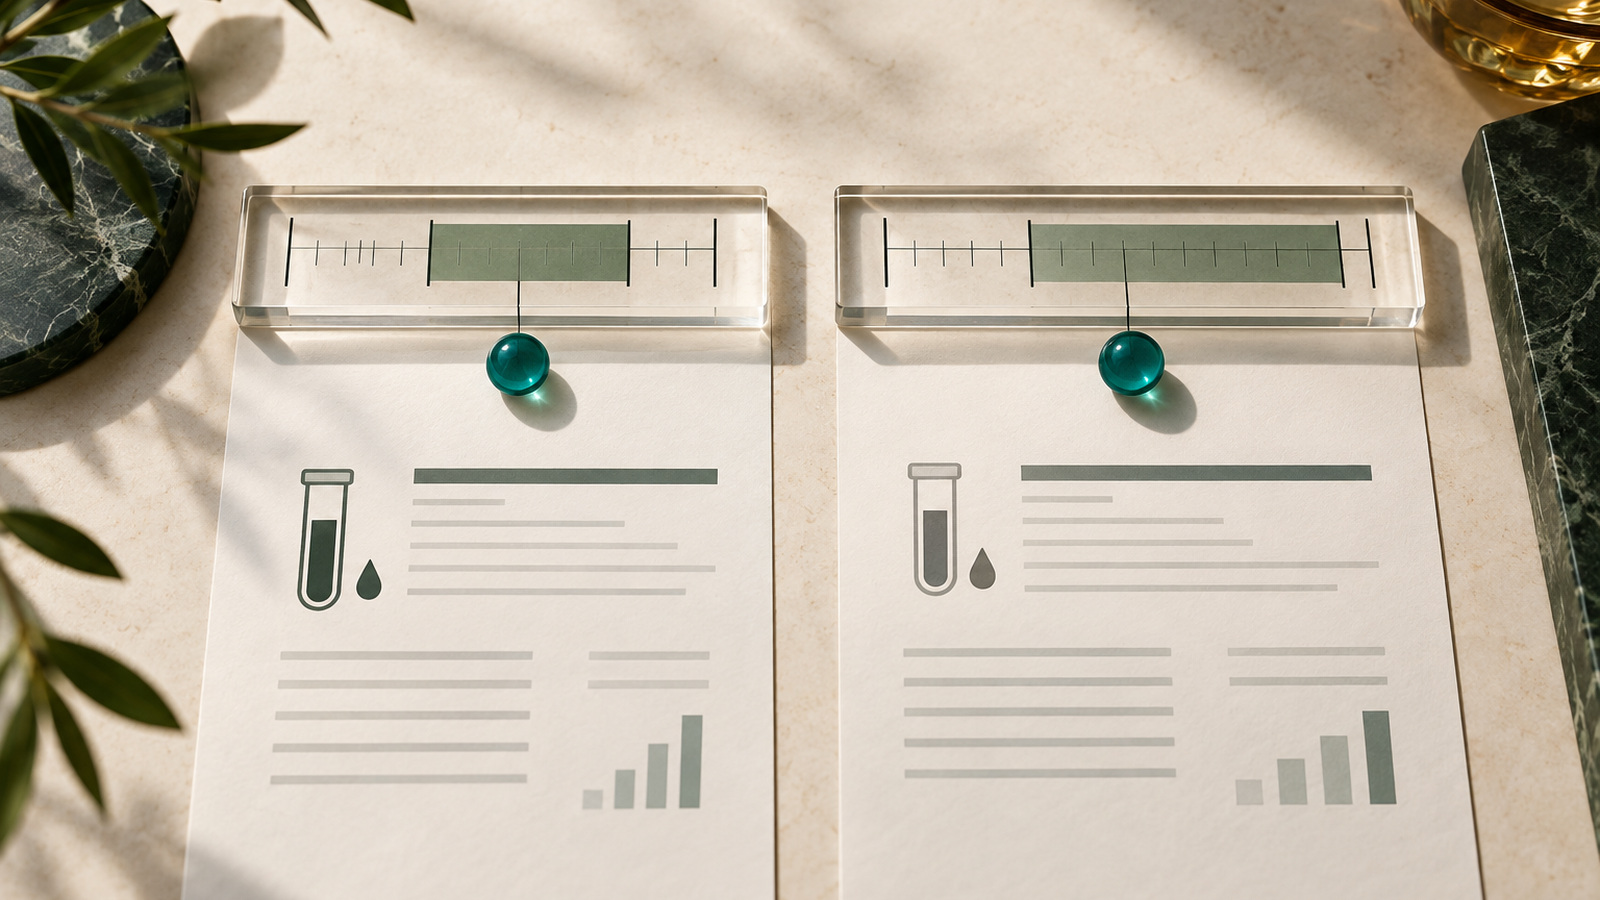
A "normal range" is set by each laboratory from results in a healthy reference group, measured with that lab's own equipment and methods — usually the middle 95% of those results. Different labs, methods and populations produce different ranges, so the right range to read your result against is the one printed on your own report.
Someone asked a question on a medical forum that sounds almost too simple to be interesting.
Why do different labs give different reference ranges for iron?
It's one of the most useful questions a patient can ask. Because the answer changes how you read every result you'll ever get.
Isn't "normal" a fixed medical fact?
Most of us picture "normal" as a line that science drew once, somewhere, for everyone.
That picture is mostly wrong.
For a small number of tests, doctors use fixed decision limits agreed in national or international guidelines. But for most everyday lab values, what you see printed next to your result is a reference interval — and it's built, locally, by a process.
Once you see the process, the differences stop looking like errors.
How is a reference range actually made?
Here's the chain, simplified.
1. A lab chooses a reference group. People it considers healthy for the purpose of that test. International guidance from the Clinical and Laboratory Standards Institute (CLSI EP28) recommends at least 120 reference individuals to establish an interval.
2. It measures them with its own method. Its analysers, its reagents, its calibration.
3. It looks at the spread of results. Some people are low, most are in the middle, some are high.
4. It marks the middle 95%. The lower limit is roughly the 2.5th percentile; the upper limit roughly the 97.5th. Everything between becomes the printed range.
5. It may split the range by age, sex or other factors. Because a value typical for a teenager may not be typical for a 70-year-old.
Many labs don't build every interval from scratch; they verify a range from a manufacturer or the literature against their own population and methods. But the logic is the same: the range describes a group, measured a particular way.
Here's the part most people miss
Change any link in that chain, and the range moves.
- A different analyser or reagent can read the same sample slightly higher or lower.
- A different reference group — different ages, different diets, different altitude — can shift where the middle 95% falls.
- A different unit changes every number on the line.
Laboratory professionals say it plainly: because of differences in equipment, reagents and techniques, a normal result in one lab may be abnormal in another, and there's no universally applicable reference value for most tests.
The differences can be meaningful. A 2024 review in the British Journal of Biomedical Science describes significant bias between ferritin assays from different manufacturers — differences of roughly a third or more at clinical decision points — even with traceable standards in place.
So two labs disagreeing isn't necessarily one of them being wrong. They may simply be measuring and describing different things.
The wrong question, and the better one
The question most people type into a search bar is: "What is the normal range for this test?"
The trouble is that there isn't one answer. A number from a website comes from somebody's laboratory, somebody's method and somebody's population. It might not be yours.
The better question is: "What range did my lab use — and how does my result compare over time at the same lab?"
That question gives you an answer that actually applies to your sample.
Why a 95% range creates surprises
There's another consequence of the "middle 95%" design that almost nobody is told.
If a range is built to include 95% of healthy people, then about 5% of healthy people will fall outside it on any single test. That's not a flaw. It's the definition.
The same 2024 review makes the point that the more tests are requested, the more likely at least one will be abnormal. On a panel of ten independent tests, a healthy person has only about a 60% chance of every result landing inside its range. (Real panels aren't fully independent, so treat that as an illustration rather than an exact figure.)
That's why a single flag deserves a closer look rather than alarm. We explore this properly in What a Flagged Result Actually Means.
Your own "normal" is narrower than the population's
One more layer, and it's the most interesting.
A population range is wide because people are different. But each person tends to vary around their own set point, influenced by genetics, diet, age and activity. Your personal band is often much narrower than the lab's range.
That's why clinical chemists use tools like the reference change value — an estimate of how much a result has to change between two tests, in the same person, before the change is likely to be more than normal biological and analytical variation.
In plain language: for many markers, comparing you with your own past results can be more informative than comparing you with a population. A value can sit comfortably inside the lab's range and still have moved meaningfully for you. (That's the idea behind The Slow Drift.)
So which range should you trust?
Some practical rules.
Use the range printed on your own report. It was built or verified for the method that measured your sample.
Be careful comparing across labs. If you switch laboratories, part of any change may be the lab, not you. We look at this in Should You Stick With One Lab?
Check the unit before comparing numbers. A result in nmol/L and one in ng/mL aren't comparable without conversion.
Notice where guidelines use decision limits instead. For some tests, doctors interpret results against guideline thresholds rather than the lab's statistical range. Your doctor will know which applies.
Don't treat "inside" as a guarantee or "outside" as a verdict. There is overlap between results in healthy people and people who are unwell. The range is a reference, not a diagnosis.
What this means for you
If you've ever felt confused because your result looked "high" on one website and "normal" on your report, you weren't misreading anything. You were comparing two different references.
Once you know that, a lot of anxiety disappears. And a better habit takes its place: read your lab's range, keep your reports together, and watch your own direction over time.
Your lab's range, not the internet's.
Where mySEHA fits
This is exactly why mySEHA handles ranges the way it does.
When you upload a report, mySEHA reads the range your lab printed next to each result and uses that range first. It only falls back to its own reference library when your report doesn't print one. When neither your report nor the library provides a sound range, the value is recorded and charted but not labelled high or low — because inventing a threshold and calling something "fine" is how false reassurance happens.
Where it knows the conversion, mySEHA normalises units so results can be compared; where it doesn't, it keeps your report's unit exactly as printed rather than guessing. And because your reports sit together over time, you can see how a marker has moved at the same lab, and notice when a change coincides with switching labs.
mySEHA does not diagnose, does not name a condition, does not prescribe, and does not replace a doctor. It helps you read your result against the right reference, and bring better questions to the person who can interpret it.
If you've got reports from two different labs, that's an interesting place to start looking.
Key takeaways
- Most "normal ranges" are reference intervals: the middle 95% of results from a healthy reference group, measured with a lab's own method.
- Different equipment, reagents, populations and units produce different ranges — so compare your result with your own lab's range.
- About 5% of healthy people fall outside any single range by design, and more tests mean more chance of at least one flag.
- For many markers, your own trend over time can be more informative than a population range.
- A range is a reference point, not a diagnosis.
Frequently asked questions
Why do two labs show different normal ranges for the same test?
Each laboratory builds or verifies its range using its own equipment, reagents, methods and reference population. Those differences shift where the middle 95% of healthy results fall. That's why you should use the range printed on your own report.
Is a result just outside the range a problem?
Not necessarily. By design, about 5% of healthy people fall outside a typical reference range on any one test, and food, exercise, timing and medicines can move values. How far outside it is, and whether it has changed over time, matter more — discuss it with your doctor.
Can I compare my results from different labs?
You can, but carefully. Differences between methods mean part of a change may come from the lab rather than from you. Check that units match, and where possible track a marker at the same laboratory.
Where this comes from
- Testing.com (Association for Diagnostics & Laboratory Medicine) — Reference Ranges and What They Meanhttps://www.testing.com/articles/laboratory-test-reference-ranges/
- Timbrell NE. The Role and Limitations of the Reference Interval Within Clinical Chemistry and Its Reliability for Disease Detection. British Journal of Biomedical Science, 2024https://pmc.ncbi.nlm.nih.gov/articles/PMC10932992/
- Analyse-it — Choosing a reference interval method (summary of CLSI EP28-A3c)https://analyse-it.com/learn/choosing-a-reference-interval-method
- MedlinePlus — How to Understand Your Lab Resultshttps://medlineplus.gov/lab-tests/how-to-understand-your-lab-results/
Read your own results in context.
An article explains the general picture. mySEHA reads your own results together — connecting them, in Arabic or English.
Join the waitlist →